Hi !
I am trying to insert a chartjs graph on my website using custom element. I used the example here : https://www.wix.com/velo/example/chart.js-custom-element to start.
My code seems to work fine on the preview website, but when I publish the website, the charts do not appear. Data and labels array seem to be empty and the console says “Uncaught TypeError: this._parent is null” referring to line 13 in the custom-element code in velo :

chart-elem being my custom-element id.
Any Idea on how to fix this ?
Thanks in advance
Hey Xavier,
When the constructor code runs, there is actually no chart-elem as yet. That line is giving you a reference back to the Custom Element definition in line 71, not the ID of the custom element. Since it crashes in the constructor, it would block the rest of the code.
Since that line is only used again to set the display of the custom element to block in line 37 of the example, you can comment out/remove both lines. Technically, although I haven’t tested it myself, it should work fine without them.
If not, in the constructor, you can add a stylesheet instead to do the same styling between line 6 and line 7 (where this._shadow and this._root were defined) - Example below
//Add this between lines 6 and 7
let style = document.createElement('style');
style.innerHTML = `:host {
    display: block;
}`;
this._shadow.appendChild(style); //The this._shadow variable points to the Shadow Dom inside the custom element.
Hi Chris
Thank you for your answer it worked !
I indeed needed to add the stylesheet as you said.
thank you for being this responsive
Xavier
My pleasure, glad it helped
Hey @chris-derrell Thanks for assisting Xavier. I have run into the same issue, however even when testing via the test site I receive a weird error even after changing the code (like its cached, but I clear it and even force a js filename change). The weird thing is sometimes after a page load, the chart actually loads.

Even with the style attribute removed…
That looks very strange indeed, and may have been a Wix specific issue. Has it cleared up, and have you gotten to a solution?
I’m running the exact same issue as “Unknown Member”.
Here is my current construct:
The file chartDist.js:
import Chart from 'chart.js/auto';


class ChartElem extends HTMLElement {
    constructor() {
        super();
        this._shadow = this.attachShadow({ mode: 'open' });
        this._root = document.createElement('canvas');
        this._root.setAttribute("id", "myChart");
        this._root.setAttribute("style", "width: 850px");
        this._root.setAttribute("align-items", "center");
        this._shadow.appendChild(this._root);


        this._parent = document.querySelector("chart-elem");
    }


    static get observedAttributes() {
        return ['chart-data'];
    }


    attributeChangedCallback(name, oldValue, newValue) {
        if (name === 'chart-data') {
            this.chartData = newValue;
        }
    }


    get chartData() {
        return this._chartData;
    }


    set chartData(d) {
        this._chartData = JSON.parse(d);
        sessionStorage.setItem('chartData', d);
        if (this._connected)
            this.render();
    }


    connectedCallback() {
        this._parent.style.display = "block";


        let savedData = sessionStorage.getItem('chartData');
        if (savedData && savedData !== 'undefined' && !this._chartData)
            this._chartData = savedData;
        this._connected = true;
        if (this._chartData) {
            this.render();
        }
    }


    render() {
        const ctx = this._shadow.getElementById('myChart').getContext('2d');
        const myChart = new Chart(ctx, {
            type: 'radar',
            data: this.chartData,
            options: {
                elements: {
                    line: {
                        borderWidth: 3
                    }
                },
                scales: {
                    r: {
                        min: 0,
                        max: 100
                    }
                }
            },
        });
    }
}


window.customElements.define('chart-elem-dist', ChartElem);
The error I get on first load of the page
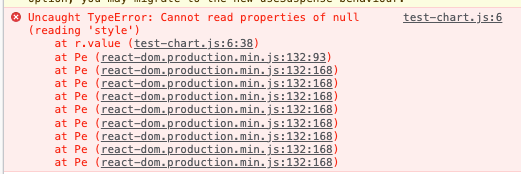
chartDist.js:15 Uncaught TypeError: Cannot read properties of null (reading 'style')
    at r.value (chartDist.js:15:14)
    at chartDist.js:41:3
    at chartDist.js:41:3
And exactly like the previous comment, if I go back to previous page then forward to this page again, then the graph shows. Like if the custom-element needed some kind of library loaded before the custom-element and the sequencing is not correct.
I tried to embed it without the NPM package, however I’ve not investigated further yet as unsure how it would work with a custom element.
If you have any clues, I would happily take on your perspective.
Many thanks 
Hey, sorry for not replying sooner, completely forgot. So I did solve the issue. I would like to believe it was related to populating chart.data too soon after initialising chart (I might be wrong though, but this is what I remember roughly).
var chart;

$w.onReady(async function () {
    chart = new ChartJSAPI($w('#customElement2'));

    //Do some await tasks

    chart.customization = chartWealthManagementCustomization;

    chart.data = {
            //Set pointradius to 0 to hide all the points on the graph
            datasets: [{ data,
                pointRadius: 0,
                borderColor: borderColor.toString(),
                backgroundColor: backgroundColor.toString()
            }]
        }
  }
Let me know if this isn’t the case and I will try dig deeper. PS, would love a github type implementation into wix 
I did also nuke the style attribute line
constructor() {
super();
this._shadow = this.attachShadow({ mode: “open” }); // sets and returns ‘this.shadowRoot’
const wrapper = document.createElement(“canvas”);
wrapper.setAttribute(“id”, “myChart2”);
//wrapper.setAttribute(“style”, “width: 100%”);
this._shadow.appendChild(wrapper);
this._parent = document.querySelector(“chart-elem2”);
}
Good to know. I tried these tips but I remain unsuccessful. I wonder if this is a bug in 4.2.0. Which version did you implement?
I’m using 4.2.0. Hmm so strange…


