Leafletjs -> Overview with markers from a database

So I wanted to use leaflet, but the apps for Wix were all google maps. So I thought lets try to implement it. This is the first part for using leaflet. Later on I will use it’s possibilities to plot gpx files.

In this case I have a database table which contains information for the overview. The datacollection has the columns ‘marker_id’, ‘marker_description’, ‘marker_long’, ‘marker_lat’. I won’t give my exact example for it’s also taking into consideration language based description columns.

After making the datacollection I made a backend file. There is still one part not correct in it, so the code I’ll fix later on. This is working however.

//file: backend/vttLeaflet.jsw
import wixData from 'wix-data';

export function getOverviewPoints() {
	// this is temporary for the query isn't working yet
	let oMarkers = [{
		"marker_description": "CWU",
		"marker_id": "en_cwu",
		"marker_lat": "56.824421",
		"marker_long": "-5.125890"
	},{
		"marker_description": "DC2C",
		"marker_id": "en_dc2c",
		"marker_lat": "50.317583",
		"marker_long": "-4.084997"
	}];
	
	// This is not working yet
	wixData.query("markers")
		.find()
	  	.then((oMarkers) => {		
			for (const oMarker in oMarkers) {
				this.oMarkers.push({
					"marker_id": oMarker.marker_id
				});
			}
		});
		
	return oMarkers;
}

Then I made a page ‘Overview’. On it I placed an HTML element and I called it ‘htmlOverview’. To populate the markers, I added some page code

import {getOverviewPoints} from 'backend/vttLeaflet';
import {session} from 'wix-storage';

$w.onReady(function () {
	setTimeout(function(){
		getOverviewPoints().then(oMarkers => {
			$w("#htmlOverview").postMessage(oMarkers);
		});
	}, 1000);
});

This code will get the markers from the backend and then pass them to the html element placed on the page. Obviously you need to do something with that data. You want to display a world map with the markers on it. So you need to add code to the html element.

EDIT: slowdown the code
I came to the conclusion, that the preview was fine but if you navigated away and back to the page, it didn’t generate the make. I have had similar issue with other languages so I tried the trick adding a small timeout. That took care of this.

<!DOCTYPE html>
<html style="height: 100%; width: 100%">
    <head>
        <link rel="stylesheet" 
              href="https://unpkg.com/leaflet@1.2.0/dist/leaflet.css"
              integrity="sha512-M2wvCLH6DSRazYeZRIm1JnYyh22purTM+FDB5CsyxtQJYeKq83arPe5wgbNmcFXGqiSH2XR8dT/fJISVA1r/zQ=="
              crossorigin=""/>
        <script src="https://unpkg.com/leaflet@1.2.0/dist/leaflet.js"
                integrity="sha512-lInM/apFSqyy1o6s89K4iQUKg6ppXEgsVxT35HbzUupEVRh2Eu9Wdl4tHj7dZO0s1uvplcYGmt3498TtHq+log=="
                crossorigin="">
        </script>
        <style>
            body {
                background-color: transparent;
                width: 100%;
                height: 100%;
                overflow: hidden;
                margin: 0;
            }
            #vttMapOverview {
                width: 100%;
                height: 100%;
            }
        </style>
    </head>
    <body>
        <div id="vttMapOverview"></div>
        <script type="text/javascript">
            // When data received
            window.onmessage = (event) => { 
                if (event.data) { 
                    // initialize map
                    let mapOverview = L.map('vttMapOverview', {
                        zoom: 13
                    });

                    // Add tilelayer and define layout of map
                    L.tileLayer('https://{s}.tile.openstreetmap.org/{z}/{x}/{y}.png', {
                        maxZoom: 19,
                        attribution: 'Some text you want to put here (bottom right of the map)'
                    }).addTo(mapOverview);

                    // Add markers
                    const OMarkers = event.data; 
                    let markerCollection = L.featureGroup();
                    for (const OMarker in OMarkers) {
                        const marker = L.marker(
                            [OMarkers[OMarker]["marker_lat"],OMarkers[OMarker]["marker_long"]], {
                                title: OMarkers[OMarker]["marker_description"]
                            }
                        ).addTo(mapOverview);
                        markerCollection.addLayer(marker);
                    }
                    mapOverview.fitBounds(markerCollection.getBounds());

                } 
            };
        </script>
    </body>
</html>

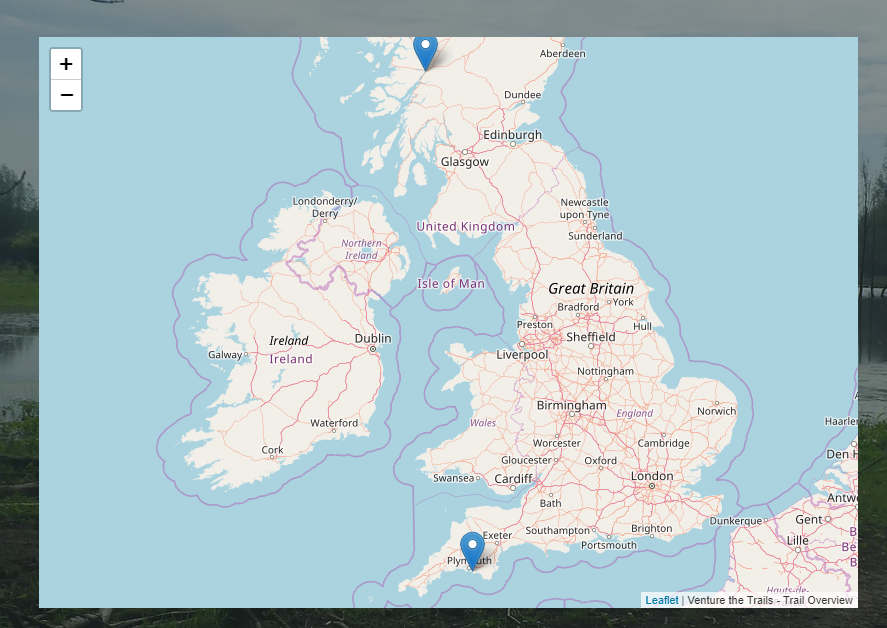
This code is added to the html element. It will process the data passed from the ‘postMessage’ and place a marker for each entry then it will zoom to fit the map to all the markers. Hovering over the marker will give the description. Off course there are many more options. I will still do:

  • custom marker icons to illustrate status
  • click function to open the related page
  • change the tile layer (great collection can be found here)

When I figured out my back-end code I correct it here too. Oh, the result will be something like this. For those wondering, it’s going to be a map displaying trail runs I did/will do

1 Like

This is truly amazing!!! Great job and thank you for sharing on the forum :heart:

Would you be interested in allowing me to feature your code in one of my tutorials on YouTube?

In return you will get exposure to many subscribers and new viewers every day.

Working configuration
Okay, so now I can finalize this post for a working configuration. The result is a map with markers from a multiligual database. When you click on a marker, the corresponding page opens. The marker uses custom icons. To open the corresponding page, a call back is done from the html object so that Wix handles the actual opening of the page. This time I didn’t bother to change columns to mare natural names, so it’s a one on one copy from my site.

Step 1: Create a backend function to fetch data.

import wixData from 'wix-data';
export function getTrailMarkers(strLanguage) {
	return wixData.query("trails")
		.find()
	  	.then((resultTrails) => {
	  		const oTrails = resultTrails.items;
	  		let arrTrails = [];
	  		
	  		// Transform to required columns
	  		for (const iTrail in oTrails) {	  			
	  			if (strLanguage === "nl") {
		  			arrTrails.push({
		  				"_id": iTrail,
		  				"trail_lat": oTrails[iTrail].trail_lat,
		  				"trail_long": oTrails[iTrail].trail_long,
		  				"trail_title": oTrails[iTrail].trail_title_nl,
		  				"trail_code": oTrails[iTrail].trail_code
		  			});
	  			} else {
		  			arrTrails.push({
		  				"_id": iTrail,
		  				"trail_lat": oTrails[iTrail].trail_lat,
		  				"trail_long": oTrails[iTrail].trail_long,
		  				"trail_title": oTrails[iTrail].trail_title_en,
		  				"trail_code": oTrails[iTrail].trail_code
		  			});	  				
	  			}
	  		}
	  		
			return arrTrails;
		});
}

Again, I filter any columns I don’t want. No sorting for that isn’t required. Filters will be added later in time.

Step 2: Collect the data and pass it to a html element

import {getTrailMarkers} from 'backend/vttTrails';
import {local} from 'wix-storage';
import wixLocation from 'wix-location';

$w.onReady(function () {
	// Initiate map
	setTimeout(function(){
		getTrailMarkers(local.getItem("vttLanguage")).then((oTrails) => {
			$w("#htmlOverview").postMessage(oTrails);
			$w("#htmlOverview").show();
		});
	}, 1000);

	// Capture marker click
	$w("#htmlOverview").onMessage((event) => {
		wixLocation.to("/trails/" + event.data);
	});
});

In this function, after a second freeze I collect the data. For some reason if you don’t do that, the site is too fast. I have that without Wix too. As you see, I post the returned array from the backend to the html element and then show it.

Step 3: Add code to the html element

<!DOCTYPE html>
<html style="height: 100%; width: 100%">
    <head>
        <link rel="stylesheet" 
              href="https://unpkg.com/leaflet@1.2.0/dist/leaflet.css"
              integrity="sha512-M2wvCLH6DSRazYeZRIm1JnYyh22purTM+FDB5CsyxtQJYeKq83arPe5wgbNmcFXGqiSH2XR8dT/fJISVA1r/zQ=="
              crossorigin=""/>
        <script src="https://unpkg.com/leaflet@1.2.0/dist/leaflet.js"
                integrity="sha512-lInM/apFSqyy1o6s89K4iQUKg6ppXEgsVxT35HbzUupEVRh2Eu9Wdl4tHj7dZO0s1uvplcYGmt3498TtHq+log=="
                crossorigin="">
        </script>
        <style>
            body {
                background-color: transparent;
                width: 100%;
                height: 100%;
                overflow: hidden;
                margin: 0;
            }
            #vttMapOverview {
                width: 100%;
                height: 100%;
            }
        </style>
    </head>
    <body>
        <div id="vttMapOverview"></div>
        <script type="text/javascript">
            // When data received
            window.onmessage = (event) => { 
                if (event.data) { 
                     // initialize map
                    let mapOverview = L.map('vttMapOverview', {
                        zoom: 13
                    });

                    // Add tilelayer and define layout of map
                    L.tileLayer('https://{s}.tile.opentopomap.org/{z}/{x}/{y}.png', {
                        maxZoom: 15,
                        attribution: 'Venture the Trails - Trail Overview'
                    }).addTo(mapOverview);

                    // Create icons
                    const LeafIcon = L.Icon.extend({
                        options: {
                            iconSize:     [17, 25],
                            iconAnchor:   [0, 25],
                            popupAnchor:  [-5, -5]
                        }
                    });

                    const defaultIcon = new LeafIcon({
                        iconUrl: 'https://static.wixstatic.com/media/422dc1_4421597740764ea0b7c6d0efbddf9a14~mv2.png'
                    });

                    // Add markers
                    let markerCollection = L.featureGroup();
                    const oTrails = event.data;               
                    for (const oTrail in oTrails) {
                        const marker = L.marker(
                            [oTrails[oTrail]["trail_lat"], oTrails[oTrail]["trail_long"]], {
                                title: oTrails[oTrail]["trail_title"],
                                icon: defaultIcon,
                                trail_code: oTrails[oTrail]["trail_code"]
                            }
                        ).addTo(mapOverview);
                        markerCollection.addLayer(marker);
                    }
                    mapOverview.fitBounds(markerCollection.getBounds());

                    // Add events
                    markerCollection.on("click", function (event) {
                        const clickedMarker = event.layer;
                        
                        window.parent.postMessage(clickedMarker.options.trail_code, "*");
                    });
                } 
            };
        </script>
    </body>
</html>

A complete html file. This should work standalone if you replace the part which gets the array from postmessage. All script code can be found in the leaflet manual here. But in short, I initialize the map with a tile layer of choice. I create a default leaf icon where I determine the size an anchor on the map. Then I add a url for the image. This is a Wix URL. I bet this will change to a url I pass from Wix so they are dynamic. Then I configure each marker. As you see, a custom option ‘trail_code’ is added. This is to be passed back to Wix.

Step 4: Pass the click to Wix and open the page
In the code above, there is a configured click event. This is fired when you click on a marker. From the marker clicked, the custom option ‘trail_code’ is collected and posted to Wix. In the Wix page code (see step 2) you see a ‘onMessage’ event. This catches the ‘trail_code’ and then uses it to launch a dynamic page.

So this is a complete usable sample. In time mine will be enhanced for I have a small todo list for it (add filters).